
If you opened your Shopify analytics in late September and saw your conversion rate jump, or your sessions drop, do not rush to celebrate or to panic. Shopify changed how it counts sessions on September 21, 2026. A lot of the numbers you watch every day now come from a different baseline, even though your store itself may not have changed at all.
This guide explains what changed, which numbers are affected, which ones are not, and how to read your reports sensibly over the next few weeks, so you do not make decisions based on a change in measurement.
What Shopify changed
According to Shopify’s changelog, the update refines how sessions are counted so that the default view focuses on human visitor activity. Two things stand out:
- Bot and system traffic is classified more consistently. It is now excluded from the default sessions view through a “Human or bot” filter, which gives a cleaner picture of real shoppers.
- Valid shopper journeys stay visible even when they do not include a standard pageview.
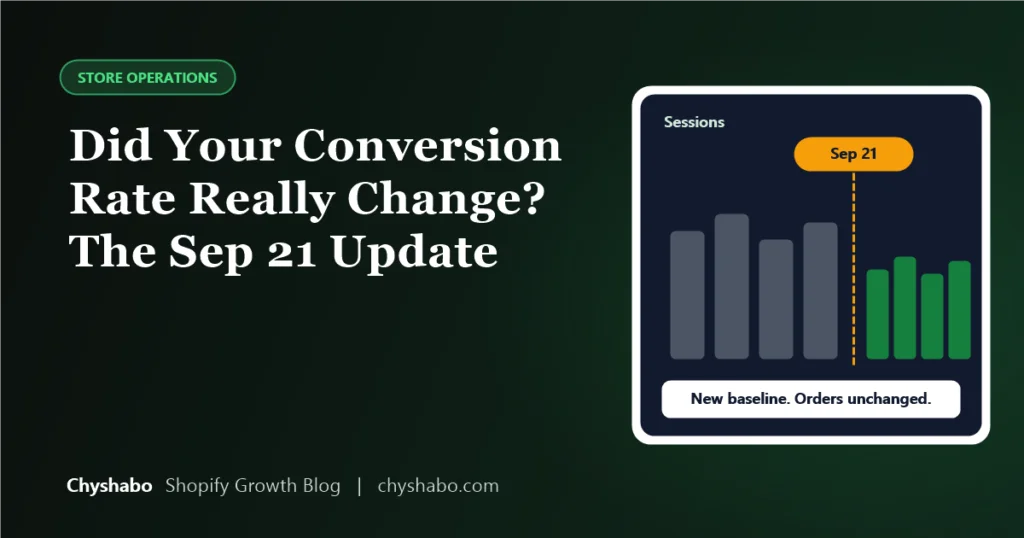
Shopify says the change took effect on September 21, and that it has not restated historical data. Its advice is to treat the date as a new baseline for session-based metrics.
Which numbers may look different
Shopify lists these as affected:
- Sessions
- Conversion rate
- Add-to-cart rate
- Reached checkout rate
- Checkout conversion rate
- Bounce rate
- Pageviews per session
- Online store visitors
- Searches
And here is the important part: orders, sales and customer counts are not changed by this update. The money you took is the money you took.
Why your conversion rate may have “jumped”
Conversion rate is orders divided by sessions. If the number of orders stays the same but the session count falls because bot or system traffic is no longer counted, the rate goes up. It is the same store making the same sales, measured against a smaller and cleaner number of visits.
The reverse can also happen. Some stores may see sessions rise if journeys that used to be missed are now counted. So we cannot tell you which direction your own numbers will move. What we can say is that a change that appears exactly on or after September 21, without a change you made to your store or ads, is very likely a measurement effect.
Say a store gets 10 orders from 500 sessions, a 2% conversion rate. If 100 of those sessions were bot or system traffic that is now filtered out, the same 10 orders come from 400 sessions, which is 2.5%. Nothing improved. The denominator changed.
How to read your reports from here
1. Do not compare across the date without a note
A chart that runs from early September to early October now mixes two ways of counting. Add a note in your own records for September 21, and compare like with like: weeks after the change against other weeks after the change.
2. Lean on the numbers that did not change
For the next few weeks, put more weight on orders, revenue, average order value and profit. These are unaffected, and they are what actually pay the bills. Our net profit calculator helps you check what is left after costs.
3. Be careful with decisions that rely on conversion rate
If you were about to pause a campaign, redesign a page or celebrate a win because of a change in conversion rate, check whether the move lines up with September 21. If it does, wait and gather a few weeks of data on the new baseline before acting. You can model what a change in conversion rate is worth with our conversion rate revenue calculator.
4. Expect your ad platform and Shopify to disagree a little more
Meta, TikTok and Google count clicks and sessions their own way. A click from an ad is not the same thing as a Shopify session, and now the gap may look different. When you compare click-through and landing page numbers to Shopify sessions, remember that they were never meant to match exactly. If your break-even ROAS is set from real orders and revenue, you are on safer ground than if it is set from sessions.
5. Check GA4 separately
If you use Google Analytics as well as Shopify’s own reports, remember that they measure sessions differently and always did. This update does not change Google Analytics, so a gap between the two tools may open up or close. Pick one source for each type of question and stick to it.
What to do this week
- Note September 21 in your reporting notes or a shared document.
- Check whether any conversion-rate movement you saw lines up with that date.
- Reset any targets that were based on old session numbers, such as “we want a 2% conversion rate”, once you have two to four weeks of data on the new baseline.
- Hold off on big conclusions from the weeks that straddle the change.
- Tell anyone who looks at your reports, such as a partner, an ads manager or a freelancer, so nobody takes credit or blame for a measurement shift.
When a real problem is hiding behind the change
A new baseline can also make a real problem easier to miss. If your orders fell, that is not a measurement effect, because orders are unchanged by the update. A drop in orders deserves a proper look at your traffic, ads, offer, page speed and checkout. If you are not sure whether a change is real or a reporting effect, that is exactly what a store and funnel audit is for, and our conversion rate optimization and sales reporting work are built on numbers you can trust.
Final thoughts
Your conversion rate probably did not really change. Shopify changed how it counts. Keep the date in mind, give more weight to orders and revenue for a few weeks, and let the new baseline settle before you change anything because of it.